One of our greatest scientific challenges is to effectively understand and make use of the vast amount of data being produced in a variety of fields. Visual data analysis will be among our most-important tools for understanding such large-scale, complex data sets. Visualization facilitates the reasoning process by supporting the human capacity to perceive, understand, and discuss complex data. In this talk, Dr. Chris Johnson presents visual analysis techniques, insights, and examples of how visualization can enable understanding in the fields of biology, astronomy, medicine, and engineering.
He is joined for a discussion of how data visualization can drive scientific discovery by Carnegie’s Robert Hazen, who uses network analysis to better understand the relationships among minerals on an evolving planet, and Carnegie’s Juna Kollmeier, who is working to incorporate visualization and machine-learning techniques in next-generation sky surveys to answer pressing questions about the evolution of the universe.
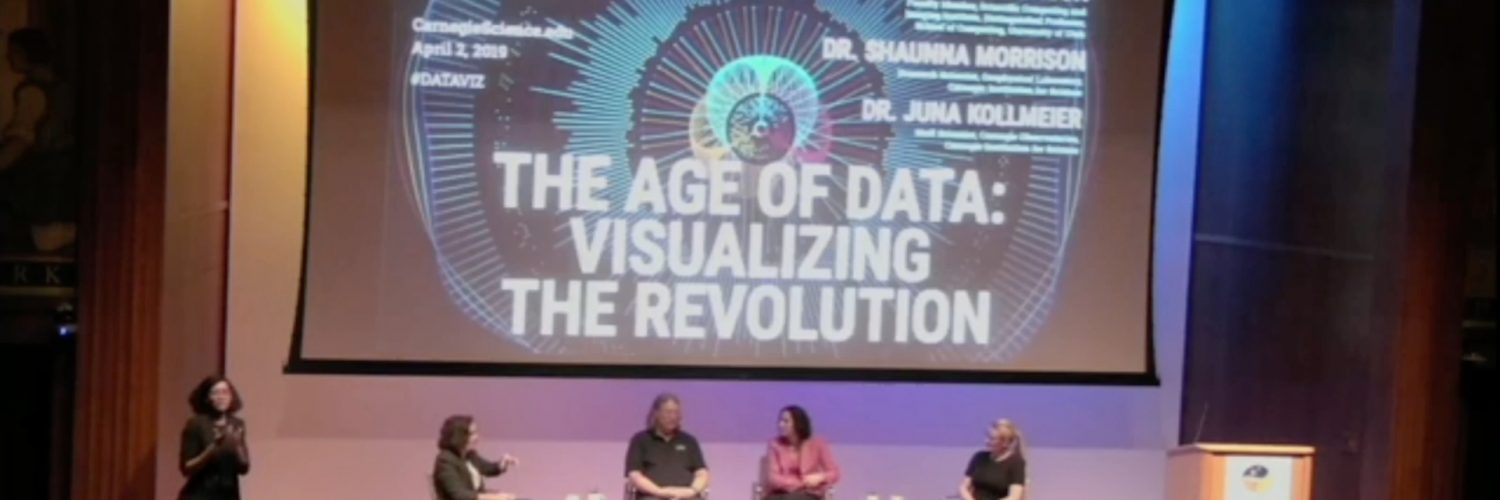
Dr. Chris Johnson: Faculty Member, Scientific Computing and Imaging Institute, Distinguished Professor, School of Computing, University of Utah
Dr. Robert Hazen: Staff Scientist, Geophysical Laboratory, Carnegie Institution for Science
Dr. Juna Kollmeier: Staff Scientist, Carnegie Observatories, Carnegie Institution for Science
#DataViz